
The anatomy of Alert-driven Attack Graphs
Azqa Nadeem ·Security Operations Centers (SOCs) are operated by human analysts who monitor and investigate security threats. They receive thousands of alerts on a daily basis that are triggered when an Intrusion Detection System or a SIEM detects something other than “allowed behavior”. Security analysts must perform considerable manual analysis to determine the nature of the threat, the strategies used by the attackers, whether they followed similar paths, etc. This is a highly monotonous and a stressful job that leads to “alert fatigue” and reduced productivity. Clearly, there must be a better way to determine attacker strategies!
Attack graphs as a solution
An attack graph (AG) is a classical cybersecurity construct that shows all the paths an attacker can utilize to penetrate a network, sometimes also including the vulnerabilities they can exploit to obtain their objectives. There is several decades worth of research focusing on AGs, which shows their utility in attack detection and forensics [1-4].
Although a great technology for enumerating potential attack paths, AGs cannot readily be used in a SOC environment: These graphs are typically constructed using a network topology and a list of pre-existing vulnerabilities in that network. The problem being that the list of vulnerabilities is often incomplete and/or outdated! So, although these AGs seem like a great way to show attacker strategies, they show what might happen, not what really happens, often providing a broad yet incomplete picture.
Alert-driven attack graphs
Contrary to traditional attack graphs, we have introduced a notion of Alert-driven attack graphs. As the name suggests, these AGs are constructed using the abundant security alerts — They show exactly what happened on the network by showing the attacker strategies visible in the alert dataset. The best part? This removes the need to use any expert input about network topology or vulnerabilities!
Alert-driven AGs provide a visual summary of what an intrusion detection system sees over time — which machines the attackers are targeting and how. Of course, the obvious caveat is that the AGs are only as good as the IDS itself — if any rule is misconfigured or is missing, the AG’s portrayal may not align with reality. That said, in addition to helping security analysts visualize attacker strategies, these AGs can, in theory, also be used to debug such faulty IDS signatures.
The tool responsible for generating these alert-driven AGs, called SAGE, uses Unsupervised sequential machine learning to learn patterns in the alert dataset and transform them into AGs. SAGE overcomes two main challenges inherent to alert datasets:
- Alert-type imbalance: Severe alerts are infrequent, while non-severe alerts appear way too frequently. How to ensure the AGs are not dominated by non-severe alerts?
- Context modelling: An alert can have a different meaning depending on the alerts that surround it. How to model this context?
A Suffix-based Probabilistic Deterministic Finite Automaton (S-PDFA) addresses these challenges by:
- Learning a suffix-based model: Alert sequences are constructed such that infrequent severe alerts appear at the end of the sequences. A suffix model brings the states modeling such severe alerts to the top, due to which the calculated statistics end up highlighting them.
- Using Alergia + Markovian properties: The state merging algorithm (Alergia merge criteria + model with Markovian properties) ensures that the states with identical future and similar pasts are merged — The states that lead to significantly different outcomes are modelled separately, even if they have the same alert signature. Thus, the state identifiers reflect the context of an alert.
The alert-driven AGs are great because they not only enable forensic analysis of prior attacks (i.e., displaying and comparing attack paths), but also provide relevant threat intelligence about attacker strategies (i.e., insights into behavioral dynamics, fingerprinting paths for attacker re-identification, and ranking attackers based on the uniqueness and severity of their actions). Moreover, the ML pipeline used by SAGE is also interpretable by design! Details can be found in the paper [5,6].
Interpretation of an alert-driven attack graph
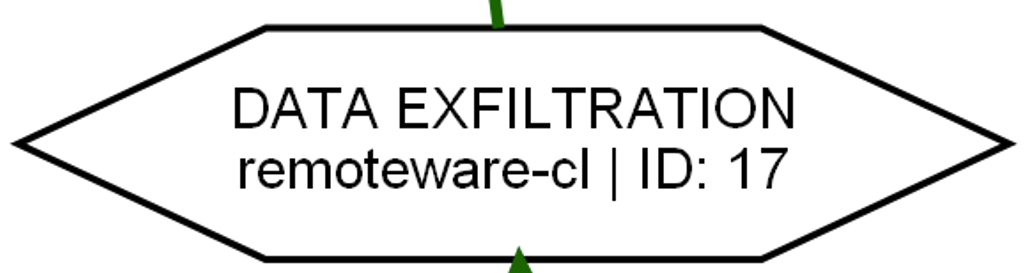
- Alert-driven AG. An alert-driven AG shows all the paths attacker(s) take to exploit one of the high-severity alert-groups (a.k.a Objectives), e.g., exfiltration, DoS, resource hijacking, data manipulation, on a specific victim machine. We do this by keeping track of all the alerts appearing between <attacker, victim> pairs, and displaying only a selection of those alert sequences in each AG. For each such sequence, it is shown up till the objective. If the objective is reached multiple times in a single sequence, it is broken into multiple attack attempts, and they are shown as individual attack paths.
Objectives that rely on each other will have AGs with a definite overlap in paths. E.g., data manipulation almost always leads to data exfiltration, thus their AGs have a significant overlap.
- Objective variants. Related to context modelling, an AG shows different “variants” of the objective when there exist significantly different paths that involve that particular objective.
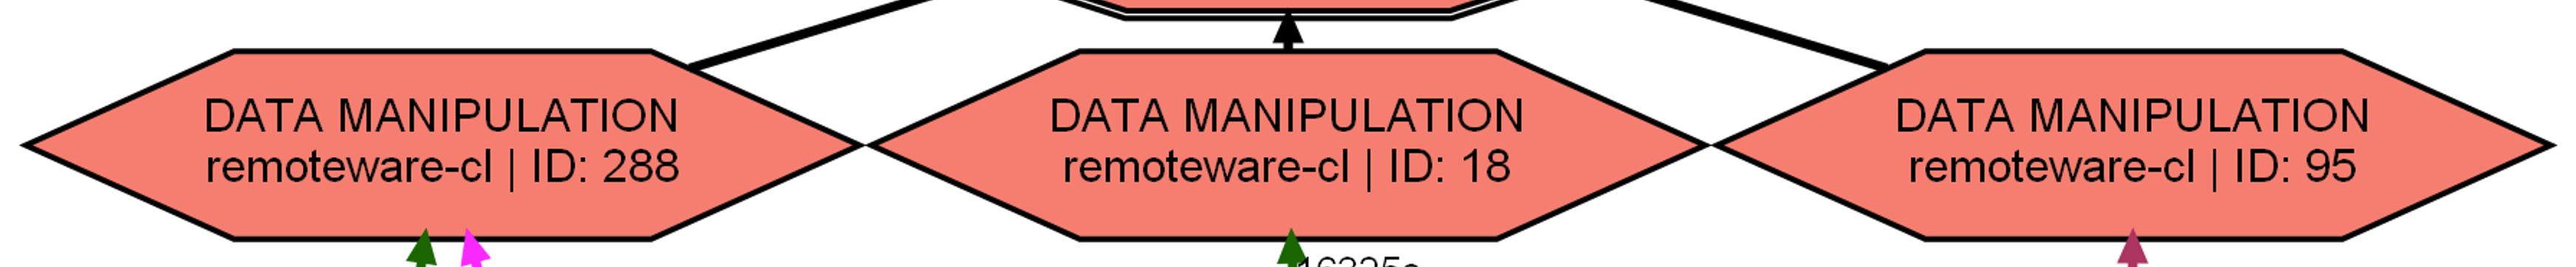
- Vertices. Each vertex in an AG refers to an episode, which is an aggregation of the same class of alerts (a.k.a attack stage) occurring within
wseconds of each other. The vertex label shows the attack stage, the service running on the victim, and an identifier denoting the context in which the episode appeared in the data.

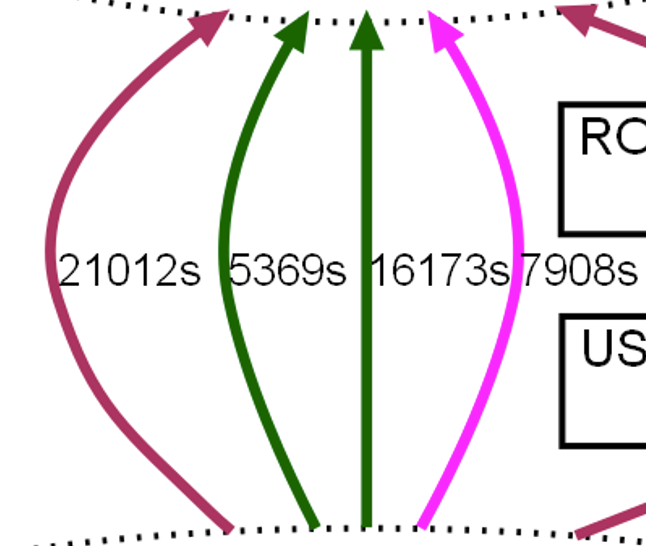
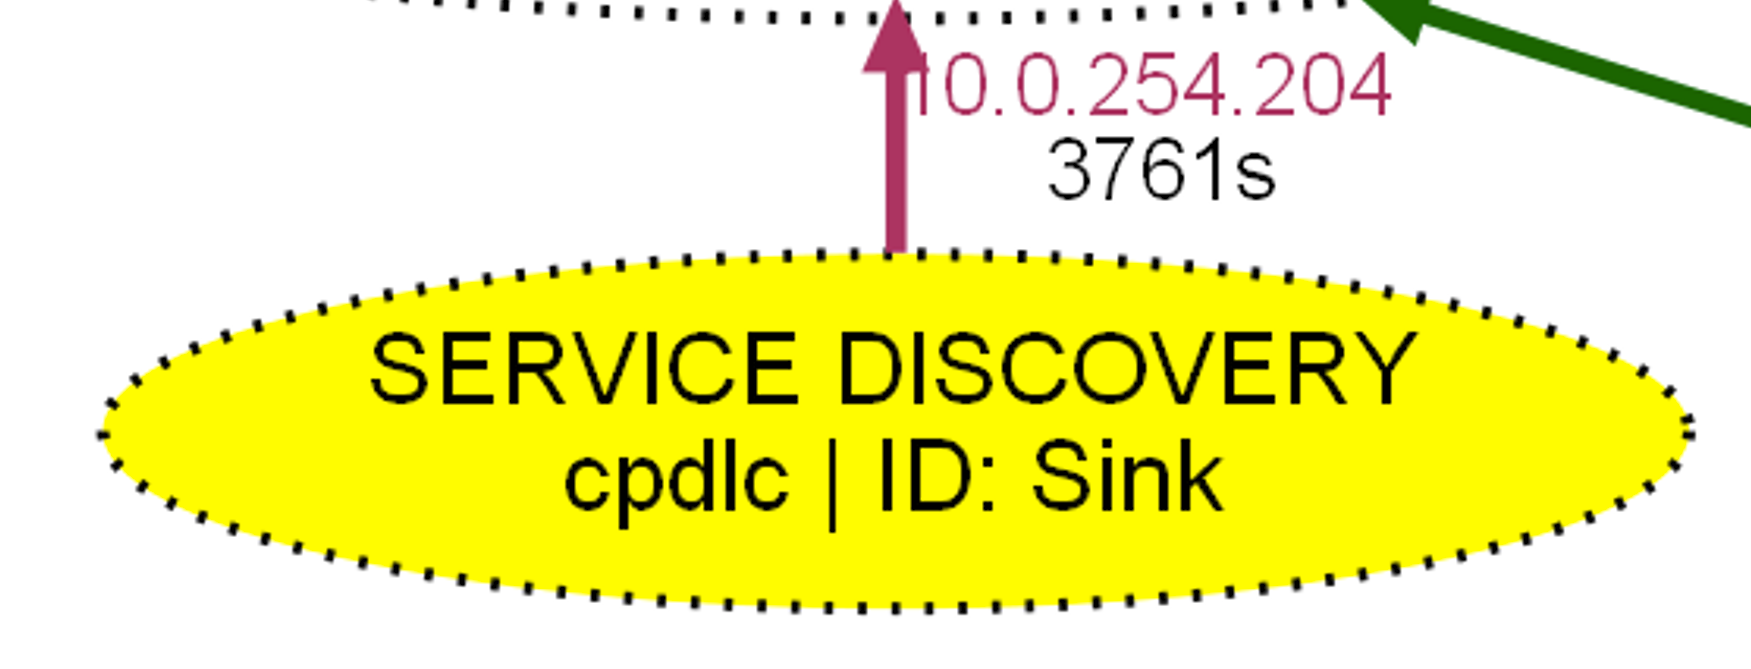
- Timestamps. The edges correspond to the temporal relationship between episodes as determined by the alert sequences. The edge labels shows the start time of the previous episode. These timestamps show the time elapsed since the first alert was observed (in seconds).

- Differentiate teams. Each attacker group/team is assigned a unique edge color. This makes it easier to differentiate between attempts made by different attacker groups.
- Episode severity. The shape of the vertices refer to the severity of the episodes, i.e., a circle for a low-severity episode, a box for a medium-severity episode, and a hexagon for a high-severity episode. Vertices may also have a dotted border (a.k.a Sinks) if their corresponding episodes were way too infrequent to learn anything from.


- First action. The IP address of an attacker making an attempt is given close to the first vertex of that attack path. This first vertex is also colored yellow for easy identification.
Design decisions to manage AG size
One major criticism faced by traditional attack graphs is how big and complex they can get. Thus, the alert-driven attack graphs produced by SAGE are intentionally kept small and simple:
- Each AG is generated on a per-victim, per-objective basis. Instead of showing all the patterns in the alert dataset, the analysts can focus their attention on just the alerts that correspond to a particular attack on a specific victim.
- Alerts are aggregated into episodes so as not to see many duplicate vertices appearing one after the other.
- We do not show the context of low-severity episodes: The low-severity episodes are not too interesting for analysis and yet they appear way too frequently compared to severe episodes. Thus, to reduce the number of vertices related to low-severity episodes, we remove the context identifier from the vertex label. This produces a single vertex for each <attack stage, service> combination.
- Among the alert sequences, only those that reach the objective at least once are shown in the corresponding AG. This means that an incomplete path does not appear in any AG. This also applies to an incomplete secondary attempt after successfully reaching one of the objectives.
The complexity analysis of alert-driven AGs can be found in the paper [5,6].
DIY Attack Graphs with SAGE
SAGE is available as open source! We have released it in a Docker container that makes integration convenient. Feel free to give it a try!
Of course, the parameter settings can be changed depending on the use case and the alert dataset. For example, the code can be modified to display one AG showing all the victims targeted by a specific attacker, or all the attackers that target a specific victim regardless of the objective. The time window w of an episode can be made shorter or longer depending on alert density. More details on parameters are available in the README.
In summary
We discussed a new paradigm of attack graphs that are learned directly from security alerts. The key strength of alert-driven AGs is their ability to summarize and visualize attacker strategies on a per-victim, per-objective basis that can be used by SOC analysts to reduce their workload. While traditional AGs have their uses, alert-driven AGs are geared towards AI-enabled forensic analysis and threat intelligence generation.
This article is part of on-going work related to alert-driven AGs. Currently, we are looking into (i) batch processing of alerts to generate evolving attack graphs, (ii) adversarial robustness of alert-driven AGs, and (iii) attack prediction using alert-driven AGs. For questions/comments, please reach out to us.
References
[1] Jha, S., Sheyner, O., & Wing, J. (2002, June). Two formal analyses of attack graphs. In Proceedings 15th IEEE Computer Security Foundations Workshop. CSFW-15 (pp. 49-63). IEEE.
[2] Ning, P., & Xu, D. (2003, October). Learning attack strategies from intrusion alerts. In Proceedings of the 10th ACM conference on Computer and communications security (pp. 200-209).
[3] Ou, X., Govindavajhala, S., & Appel, A. W. (2005, August). MulVAL: A Logic-based Network Security Analyzer. In USENIX security symposium (Vol. 8, pp. 113-128).
[4] Noel, S., Elder, M., Jajodia, S., Kalapa, P., O’Hare, S., & Prole, K. (2009, March). Advances in topological vulnerability analysis. In 2009 Cybersecurity Applications & Technology Conference for Homeland Security (pp. 124-129). IEEE.
[5] Nadeem, A., Verwer, S., Moskal, S., & Yang, S. J. (2021). Alert-driven Attack Graph Generation using S-PDFA. IEEE Transactions on Dependable and Secure Computing.
[6] Nadeem, A., Verwer, S., Moskal, S., & Yang, S. J. (2021, November). Enabling visual analytics via alert-driven attack graphs. In Proceedings of the 2021 ACM SIGSAC Conference on Computer and Communications Security (pp. 2420-2422).